Thursday, February 10, 2011

VPythonで点光源を設定する

VPythonで点光源を設定するには、以下のコードを実行します。

# coding=UTF-8
from visual import *
# 立方体を作成
box1 = box(pos=(0, 0, 0), length=6, width=6, height=0.5,
color=(0xff/255.,0xff/255.,0xff/255.))
# 球を作成
sphere1 = sphere(pos=(0, 1.5, 0), radius=1,
color=(0xff/255.,0xff/255.,0xff/255.))
# カメラが見る点を指定
scene.center = (0,2,0)
# 緑色の点光源を設定
lamp1 = local_light(pos=(-2, 1.5, 0), color=color.green)
# 青色の点光源を設定
lamp2 = local_light(pos=(2, 1.5, 0), color=color.blue)


実行画面


動作環境
Python 3.1.3, VPython 5.41

Tuesday, February 08, 2011

Graphvizでグラフの方向を変える

Graphvizでグラフの方向を変えるには、以下のようにrankdir attributeを使用します。

graph11.dot(UTF-8で保存)
graph graph11
{
graph[rankdir="LR"];
node [fontname="MS Gothic"];
項目1 -- 項目2 -- 項目3;
項目2 -- 項目4;
}

実行コマンド
dot -Gviewport=300,200 -Gresolution=72 -Tpng graph11.dot -o test11.png

出力画像


動作環境
Graphviz 2.26.3

関連情報
Graphvizまとめ
graphvizのサイト
http://graphviz.org/

Monday, February 07, 2011

VPythonでカメラを向ける位置を設定する

VPythonでカメラを向ける位置を設定するには、以下のコードを実行します。

# coding=UTF-8
from visual import *
# 立方体を作成
box1 = box(pos=(0, 0, 0), length=6, width=6, height=0.5,
color=(0x99/255.,0xdd/255.,0xff/255.))
# 球を作成
sphere1 = sphere(pos=(0, 1.5, 0), radius=1,
color=(0x99/255.,0xdd/255.,0xff/255.))
# カメラを向ける位置を指定
scene.center = (0,2,0)


実行画面


動作環境
Python 3.1.3, VPython 5.41

Saturday, February 05, 2011

Graphvizで線の太さを指定する

Graphvizで線の太さを指定するには、以下のようにpenwidth attributeを使用します。

graph10.dot(UTF-8で保存)
graph graph10
{
node [fontname="MS Gothic"];
項目2[penwidth="5"];
項目1 -- 項目2 -- 項目3;
項目2 -- 項目4;
}

実行コマンド
dot -Gviewport=200,200 -Gresolution=72 -Tpng graph10.dot -o test10.png

出力画像


動作環境
Graphviz 2.26.3

関連情報
Graphvizまとめ
graphvizのサイト
http://graphviz.org/

Friday, February 04, 2011

VPythonで不透明度を設定する

VPythonで不透明度を設定するには、以下のコードを実行します。

# coding=UTF-8
from visual import *
# 不透明度を設定
for lc in range(0,9):
sphere1 = sphere(pos=(lc, 0, 0), radius=1,
color=(0x99/255.,0xdd/255.,0xff/255.),
opacity=(10-lc)/10.)


実行画面


動作環境
Python 3.1.3, VPython 5.41

Wednesday, February 02, 2011

Graphvizでノードに表示するラベルを指定する

Graphvizでノードに表示するラベルを指定するには、以下のようにlabel attributeを使用します。

graph9.dot(UTF-8で保存)
graph graph9
{
node [fontname="MS Gothic"];
computer[image="computer.png", label="コンピューター"];
harddisk[image="drive-harddisk.png"];
mouse[image="input-mouse.png"];
computer -- harddisk;
computer -- mouse;
}

実行コマンド
dot -Gviewport=220,200 -Gresolution=72 -Tpng graph9.dot -o test9.png

出力画像


動作環境
Graphviz 2.26.3

関連情報
Graphvizまとめ
graphvizのサイト
http://graphviz.org/

Tuesday, February 01, 2011

VPythonでテクスチャを設定する

VPythonでテクスチャを設定するには、以下のコードを実行します。

# coding=UTF-8
from visual import *
# テクスチャを使用
sphere1 = sphere(pos=(0, 0, 0), radius=1,
material = materials.texture(
data=materials.loadTGA('sf_128x128.tga'),
mapping='spherical'))
# 回転
sphere1.rotate(angle=pi*260./180., axis=(1,0,1))


実行画面


TGAファイルを作成するには、ImageMagickを使用して以下のようなバッチで
JPEGからTGAに変換します。サイズは2の乗数に設定します。
rem 環境によって変えてね
set im=C:\Progra~1\ImageMagick-6.6.6-Q16

%im%\convert.exe sf.jpg -resize 128x128 sf_128x128.tga


動作環境
Python 3.1.3, VPython 5.41

Sunday, January 30, 2011

Graphvizでノードに表示する画像を指定する

Graphvizでノードに表示する画像を指定するには、以下のようにimage attributeを使用します。

graph8.dot(UTF-8で保存)
graph graph8
{
node [fontname="MS Gothic"];
computer[image="computer.png"];
harddisk[image="drive-harddisk.png"];
mouse[image="input-mouse.png"];
computer -- harddisk;
computer -- mouse;
}

実行コマンド
dot -Gviewport=220,200 -Gresolution=72 -Tpng graph8.dot -o test8.png

出力画像


動作環境
Graphviz 2.26.3

関連情報
Graphvizまとめ
graphvizのサイト
http://graphviz.org/

Saturday, January 29, 2011

VPythonで材質を設定する

VPythonで材質を設定するには、以下のコードを実行します。

# coding=UTF-8
from visual import *
# 木の材質
sphere1 = sphere(pos=(-2, 2, 0), radius=1,
material = materials.wood)
# でこぼこな材質
sphere2 = sphere(pos=(0, 2, 0), radius=1,
material = materials.rough)
# 大理石っぽい材質
sphere3 = sphere(pos=(2, 2, 0), radius=1,
material = materials.marble)
# プラスチックっぽい材質
sphere4 = sphere(pos=(-2, 0, 0), radius=1,
material = materials.plastic)
# 地球
sphere5 = sphere(pos=(0, 0, 0), radius=1,
material = materials.earth)
# diffuse(拡散)
sphere6 = sphere(pos=(2, 0, 0), radius=1,
material = materials.diffuse)
# emmisive(放射)
sphere7 = sphere(pos=(-2, -2, 0), radius=1,
material = materials.emissive)
# 光の影響を受けない材質
sphere8 = sphere(pos=(0, -2, 0), radius=1,
material = materials.unshaded)


実行画面


動作環境
Python 3.1.3, VPython 5.41

Thursday, January 27, 2011

Graphvizでノードの高さを指定する

Graphvizでノードの高さを指定するには、以下のようにheight attributeを使用します。

graph7.dot(UTF-8で保存)
graph graph7
{
node [fontname="MS Gothic"];
項目2[height=0.8];
項目1 -- 項目2 -- 項目3;
項目2 -- 項目4;
}

実行コマンド
dot -Gviewport=200,220 -Gresolution=72 -Tpng graph7.dot -o test7.png

出力画像


動作環境
Graphviz 2.26.3

関連情報
Graphvizまとめ
graphvizのサイト
http://graphviz.org/

Wednesday, January 26, 2011

VPythonでウインドウをフルスクリーンに設定する

VPythonでウインドウをフルスクリーンに設定するには、以下のコードを実行します。

# coding=UTF-8
from visual import *
# ウインドウをフルスクリーンに設定
scene.fullscreen = True
# 球を作成
sphere1 = sphere(pos=(0, 0, 0), radius=1,
color=(0x99/255.,0xdd/255.,0xff/255.))


フルスクリーンモードを抜けるにはESCキーを押します。

動作環境
Python 3.1.3, VPython 5.41

Monday, January 24, 2011

Graphvizでノードのフォントサイズを指定する

Graphvizでノードのフォントサイズを指定するには、以下のようにfontsize attributeを使用します。

graph6.dot(UTF-8で保存)
graph graph6
{
node [fontname="MS Gothic"];
項目2[fontsize=24];
項目1 -- 項目2 -- 項目3;
項目2 -- 項目4;
}

実行コマンド
dot -Gviewport=200,200 -Gresolution=72 -Tpng graph6.dot -o test6.png

出力画像


動作環境
Graphviz 2.26.3

関連情報
Graphvizまとめ
graphvizのサイト
http://graphviz.org/

Sunday, January 23, 2011

VPythonでウインドウの位置・サイズを設定する

VPythonでウインドウの位置・サイズを設定するには、以下のコードを実行します。

# coding=UTF-8
from visual import *
# ウインドウの位置・サイズを設定
scene.x = 50
scene.y = 50
scene.width = 150
scene.height = 150
# 球を作成
sphere1 = sphere(pos=(0, 0, 0), radius=1,
color=(0x99/255.,0xdd/255.,0xff/255.))


実行画面


動作環境
Python 3.1.3, VPython 5.41

Friday, January 21, 2011

Graphvizで背景色を指定する

Graphvizで背景色を指定するには、以下のようにbgcolor attributeを使用します。

graph5.dot(UTF-8で保存)
graph graph5
{
graph[bgcolor="#ccddff"];
node [fontname="MS Gothic"];
項目1 -- 項目2 -- 項目3;
項目2 -- 項目4;
}

実行コマンド
dot -Gviewport=200,200 -Gresolution=72 -Tpng graph5.dot -o test5.png

出力画像


動作環境
Graphviz 2.26.3

関連情報
Graphvizまとめ
graphvizのサイト
http://graphviz.org/

Thursday, January 20, 2011

VPythonでレンダリング時間を表示する

VPythonでレンダリング時間を表示するには、以下のコードを実行します。

# coding=UTF-8
from visual import *
# レンダリング時間を表示
scene.show_rendertime = True
# 球を作成
sphere1 = sphere(pos=(0, 0, 0), radius=1,
color=(0x99/255.,0xdd/255.,0xff/255.))


実行画面


動作環境
Python 3.1.3, VPython 5.41

Tuesday, January 18, 2011

Graphvizでノードの文字色を指定する

Graphvizでノードの文字色を指定するには、以下のようにfontcolor attributeを使用します。

graph4.dot(UTF-8で保存)
graph graph4
{
node [fontname="MS Gothic"];
項目2[fontcolor="#ffaa00"];
項目1 -- 項目2 -- 項目3;
項目2 -- 項目4;
}

実行コマンド
dot -Gviewport=200,200 -Gresolution=72 -Tpng graph4.dot -o test4.png

出力画像


動作環境
Graphviz 2.26.3

関連情報
Graphvizまとめ
graphvizのサイト
http://graphviz.org/

Monday, January 17, 2011

VPythonで環境光を設定する

VPythonで環境光を設定するには、以下のコードを実行します。

# coding=UTF-8
from visual import *
# 環境光を設定
scene.ambient = (0x20/255.,0xdd/255.,0x66/255.)
# 球を作成
sphere1 = sphere(pos=(0, 0, 0), radius=1,
color=(0xff/255.,0xff/255.,0xff/255.))


実行画面


動作環境
Python 3.1.3, VPython 5.41

Saturday, January 15, 2011

Graphvizでノードの塗りつぶし色を指定する

Graphvizでノードの塗りつぶし色を指定するには、以下のようにfillcolor attributeを使用します(styleにfilledを指定する必要あります)。

graph3.dot(UTF-8で保存)
graph graph3
{
node [fontname="MS Gothic"];
項目2[fillcolor="#ccddff", style="filled"];
項目1 -- 項目2 -- 項目3;
項目2 -- 項目4;
}

実行コマンド
dot -Gviewport=200,200 -Gresolution=72 -Tpng graph3.dot -o test3.png

出力画像


○動作環境
Graphviz 2.26.3/2.38.0
○インストール
・Debian StretchにGraphvizをインストールする場合は、以下のコマンドを実行します。
sudo apt-get install graphviz
○関連情報
Graphvizまとめ
・graphvizのサイト
http://graphviz.org/

Friday, January 14, 2011

VPythonで背景色を設定する

VPythonで背景色を設定するには、以下のコードを実行します。

# coding=UTF-8
from visual import *
# 背景色を設定
scene.background = (0xdd/255.,0xee/255.,0xff/255.)
# 球を作成
sphere1 = sphere(pos=(0, 0, 0), radius=1,
color=(0x99/255.,0xdd/255.,0xff/255.))


実行画面


動作環境
Python 3.1.3, VPython 5.41

Wednesday, January 12, 2011

Graphvizでノードの線の色を指定する

Graphvizでノードの線の色を指定するには、以下のようにcolor attributeを使用します。

graph2.dot(UTF-8で保存)
graph graph2
{
node [fontname="MS Gothic"];
項目2[color="#7799dd"];
項目1 -- 項目2 -- 項目3;
項目2 -- 項目4;
}

実行コマンド
dot -Gviewport=200,200 -Gresolution=72 -Tpng graph2.dot -o test2.png

出力画像


○動作環境
Graphviz 2.26.3/2.38.0
○インストール
・Debian StretchにGraphvizをインストールする場合は、以下のコマンドを実行します。
sudo apt-get install graphviz
○関連情報
Graphvizまとめ
・graphvizのサイト
http://graphviz.org/

Tuesday, January 11, 2011

VPythonでウインドウタイトルを設定する

VPythonでウインドウタイトルを設定するには、以下のコードを実行します。

# coding=UTF-8
from visual import *
# ウインドウのタイトルを設定
scene.title = 'VPython sample'
# 球を作成
sphere1 = sphere(pos=(0, 0, 0), radius=1,
color=(0x99/255.,0xdd/255.,0xff/255.))


実行画面


動作環境
Python 3.1.3, VPython 5.41

Saturday, January 08, 2011

Graphvizで日本語のグラフを描画する

Graphvizで日本語のグラフを描画するには、以下のコマンドを実行します。
dot -Gviewport=200,200 -Gresolution=72 -Tpng graph1.dot -o test1.png

graph1.dot(UTF-8で保存)
graph graph1
{
node [fontname="MS Gothic"];
項目1 -- 項目2 -- 項目3;
項目2 -- 項目4;
}


出力画像


○動作環境
Graphviz 2.26.3/2.38.0
○インストール
・Debian StretchにGraphvizをインストールする場合は、以下のコマンドを実行します。
sudo apt-get install graphviz
○関連情報
Graphvizまとめ
・graphvizのサイト
http://graphviz.org/

VPythonでラベルを描画する

VPythonでラベルを描画するには、以下のコードを実行します。

# coding=UTF-8
from visual import *
# 球を作成
sphere1 = sphere(pos=(0, 0, 0), radius=1,
color=(0x99/255.,0xdd/255.,0xff/255.))
# ラベルを作成
textlabel = label(pos=sphere1.pos,
text='球のサンプル', xoffset=70,
yoffset=80, space=100,
color=(0xff/255.,0xdd/255.,0x66/255.),
linecolor=(0xcc/255.,0xcc/255.,0xcc/255.),
height=20, border=6,
font='MS ゴシック')


実行画面


動作環境
Python 3.1.3, VPython 5.41

Wednesday, January 05, 2011

VPythonで螺旋を描画する

VPythonで螺旋を描画するには、以下のコードを実行します。

# coding=UTF-8
from visual import *
# 螺旋を作成
helix1 = helix(pos=(0, 0, 0), radius=0.6,
color=(0x99/255.,0xdd/255.,0xff/255.))


出力画面


動作環境
Python 3.1.3, VPython 5.41

Sunday, January 02, 2011

VPythonで矢印を描画する

VPythonで矢印を描画するには、以下のコードを実行します。

# coding=UTF-8
from visual import *
# 矢印を作成
arrow1 = arrow(pos=(0, 0, 0), shaftwidth=1,
color=(0x99/255.,0xdd/255.,0xff/255.))
# 回転
arrow1.rotate(angle=pi*110./180., axis=(1,0,1))


実行画面


動作環境
Python 3.1.3, VPython 5.41

Thursday, December 30, 2010

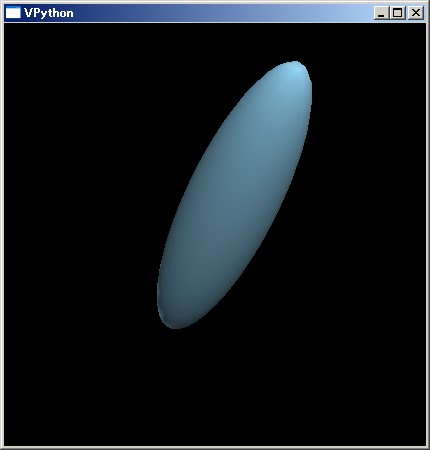
VPythonで楕円を描画する

VPythonで楕円を描画するには、以下のコードを実行します。

# coding=UTF-8
from visual import *
# 楕円を作成
ellipsoid1 = ellipsoid(pos=(0, 0, 0), size=(2,0.5,0.5),
color=(0x99/255.,0xdd/255.,0xff/255.))
# 回転
ellipsoid1.rotate(angle=pi*110./180., axis=(1,0,1))


出力画面


動作環境
Python 3.1.3, VPython 5.41

Tuesday, December 28, 2010

PHPとGDで半透明のノイズがかかった画像に変換する

PHPとGDで半透明のノイズがかかった画像に変換するには、以下のコードを実行します。

<!DOCTYPE html PUBLIC "-//W3C//DTD XHTML 1.0 Strict//EN" 
"http://www.w3.org/TR/xhtml1/DTD/xhtml1-strict.dtd">
<html xmlns="http://www.w3.org/1999/xhtml" lang="ja"
xml:lang="ja" dir="ltr">
<head>
<title>gd_test7</title>
</head>
<body>
<?php
// 入力ファイル名
$fn = "sf.jpg";
// 入力ファイルサイズ取得
$bimg = imagecreatefromjpeg($fn);
//imagefilter($bimg, IMG_FILTER_GRAYSCALE);
$sx = imagesx($bimg);
$sy = imagesy($bimg);

$img = imagecreatetruecolor($sx, $sy);
imagesavealpha($img, true);
imagealphablending($img, false);
// 半透明のノイズをかける
for($ly=0;$ly<$sy;$ly++){
for($lx=0;$lx<$sx;$lx++){
$pa = rand(5,40);
$px = imagecolorat($bimg, $lx, $ly);
$pr = ($px >> 16) & 0xff;
$pg = ($px >> 8 ) & 0xff;
$pb = $px & 0xff;
imagesetpixel($img, $lx, $ly,
imagecolorresolvealpha($img, $pr, $pg, $pb, $pa));
}
}
// ファイル出力
imagepng($img, "gd_test7.png");
// 開放
imagedestroy($img);
imagedestroy($bimg);
?>
<img src="gd_test7.png" /><br />
</body>
</html>


元画像


出力画像


動作環境
Apache httpd 2.2.17, PHP5.3.3

Monday, December 27, 2010

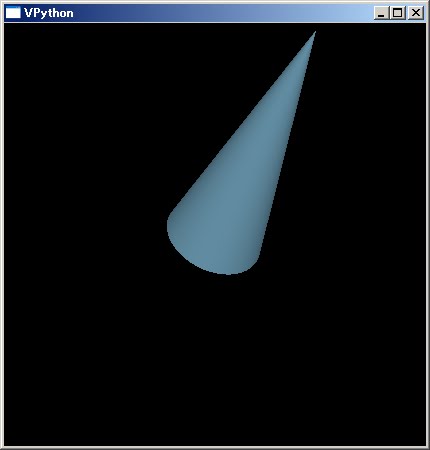
VPythonで円錐を描画する

VPythonで円錐を描画するには、以下のコードを実行します。

# coding=UTF-8
from visual import *
# 円錐を作成
cone1 = cone(pos=(0, 0, 0), radius=0.25, length=1,
color=(0x99/255.,0xdd/255.,0xff/255.))
# 回転
cone1.rotate(angle=pi*110./180., axis=(1,0,1))


出力画面


動作環境
Python 3.1.3, VPython 5.41